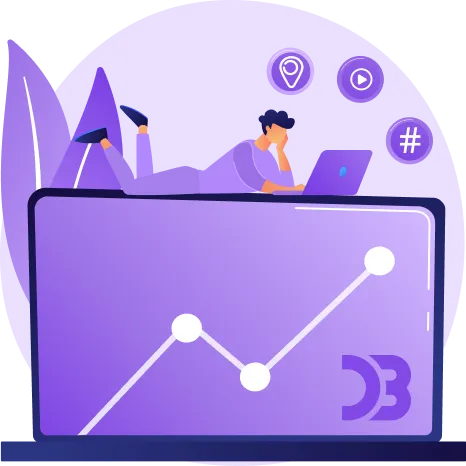
D3.JS Development Services
D3.js Development Services offer a cost-effective and powerful solution for data visualization needs. It extends HTML, CSS and JavaScript capabilities. Our skilled team maximizes project value and D3.js offers reliable support through its strong community and documentation.
D3.JS Development Services We Offer
Our D3.js development services are designed to empower businesses with compelling and insightful data visualizations. Using the power of D3.js, a robust JavaScript library were we specialize in creating custom solutions that transform complex datasets into interactive and user friendly visuals. Our team of skilled developers be skillful in crafting dynamic and responsive data dashboards for ensuring that your data is not only presented aesthetically but also in a manner that makes easy understanding and analysis.
Custom Interactive Data Visualization
With dedicated team of D3.js developers combines creativity and technical proficiency to transform complex datasets into visually stunning and meaningful representations that providing your audience with a seamless and insightful journey through your data landscape.
Scalable And Responsive Solutions
The D3.js development services focus on scalability and responsiveness. Whether you're dealing with a small dataset or handling massive amounts of information, our solutions are designed to scale seamlessly while providing an optimal user experience across various devices.
Data-driven User Interfaces (UI/UX)
Transform your user interfaces into data-driven experiences. We integrate D3.js to enhance your UI/UX design that allowing users to explore and interact with data effortlessly. This results in a visually appealing and impulsive interface that enhances user engagement.
Real Time Data Visualization
Stay ahead in today's fast paced environment with real time data visualization solutions. Our D3.js development services enable you to visualize and analyze data as it's generated to providing actionable insights and empowering quick decision making.
Custom Charting Libraries And Widgets
We specialize in building customize made charting libraries and widgets using D3.js. Whether you need specific chart types or unique data presentation elements were our development services ensure the creation of custom solutions that align with your business requirements.
Expert D3.js Consulting
Depend on our experienced D3.js consultants to guide you through the entire development process. From conceptualization to implementation and optimization, we offer expert advice to ensure your D3.js projects are successful, performant and aligned with your business objectives.
Our Experience and Expertise In Numbers
0Years
Total Experience
0
Project Completed
0
Project In Progress
0
Tech Experts On Board
0
Clients of 8+ years
0
Client Retention
0
Client Ratings
0Countries
Global Presence
Connect To our D3.JS Development Experts to Achieve a Comprehensive Business View
With our D3.js Development Services experts to unlock the power of data visualization and achieve a comprehensive business view. By collaborating with our experts, you gain access to a dedicated team that committed to understanding your business objectives and translating complex datasets into meaningful insights.
Request a team presentation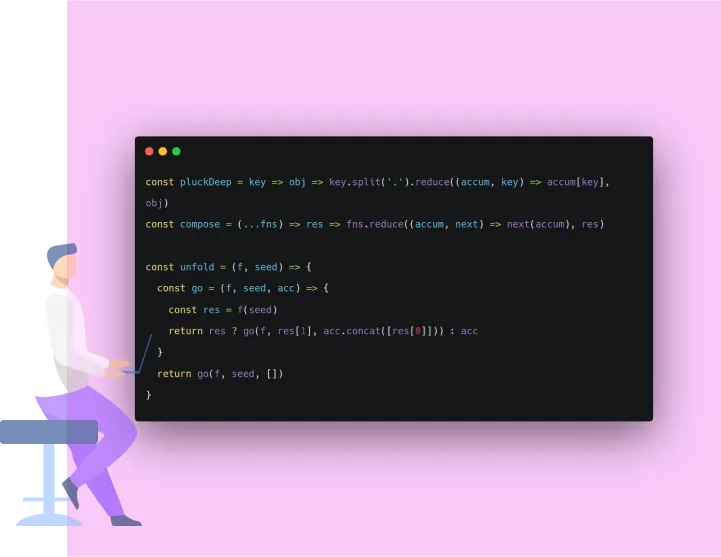
Why choose Tanθ For D3.JS Development?

Expertise and Experience
Our D3.js Development Services bring to the worktable a wealth of expertise and experience. With a team of skilled developers who have a deep understanding of the D3.js library, we ensure that your data visualization needs are met with precision and creativity. Our seasoned professionals have successfully implemented diverse projects are ranging from interactive charts to complex dashboards to making us a reliable choice for businesses seeking top-tier data visualization solutions.

Customized Solutions For Unique Needs
We recognize that individual businesses have distinct data requirements. By choosing our D3.js Development Services means pick out for customize made solutions that align with your specific needs and goals. Whether you require industry specific visualizations, custom charting libraries or complex data widgets, our team is dedicated to creating bespoke solutions that enhance the value and relevance of your data.

Seamless Integration and User Focused Design
Tanθ commitment extends beyond proficient development. We prioritize seamless integration of D3.js into your existing systems for ensuring that the implementation is smooth and efficient. Moreover, our focus on user centric design guarantees that the data visualizations we create are not only technically sound but also intuitively navigable to providing an optimal experience for your end users.

Strategic Consultation For Business Impact
Beyond the technical aspects, we offer strategic consultation to ensure that our D3.js solutions align with your broader business objectives. Our experts collaborate with you to understand your data-driven needs for providing perception on how to use data visualizations for better decision making. By choosing our D3.js Development Services, you're not just getting a development team also you're gaining a strategic partner invested in the success and impact of your data initiatives.
Our process Of D3.JS Development Services
Needs Assessment
The D3.js development process begins with a comprehensive needs assessment. We collaborate closely with clients to understand their specific data visualization requirements, business objectives and the nature of the data they aim to bring. This initial step put the foundation for a customized D3.js solution.
Strategic Planning
Following the needs assessment, we take on strategic planning. Our team creates a roadmap for D3.js development to considering factors such as data complexity, target audience and desired outcomes. This strategic approach ensures that our solutions align with your broader business goals and maximize the impact of data visualization.
Prototyping and Design
Before full scale development, we create prototypes and design mockups to provide clients with a visual representation of the proposed D3.js visualizations. This interactive phase allows for feedback and refinement to ensuring that the final product meets both aesthetic and functional requirements.
Development and Integration
With a solid plan in place, our development team engages in the actual coding and implementation by using the D3.js library. We focus on clean and scalable coding practices to make possible seamless integration into your existing systems. Throughout this phase, we prioritize transparency and open communication to keep you informed about progress.
Testing and Quality Assurance
Rigorous testing is an integral part of our D3.js development process. We conduct thorough quality assurance to identify and correct any bugs for ensuring that the data visualizations are not only visually attractive but also functionally strong. This phase guarantees a reliable and stable solution.
Deployment and Ongoing Support
Once testing is successfully completed, we proceed with deployment to integrating the D3.js visualizations into your live environment. Our commitment doesn't end with deployment as also we provide ongoing support and maintenance to address any issues, updates or additional requirements for ensuring the longevity and continued effectiveness of the implemented D3.js solutions.
Industries We Serve


Explore Trending Features
- > Responsive Design
- > Real Time Data Updates
- > Interactivity And User Engagement
- > Integration With APIs And External Data Sources
- > Advanced Animation Techniques
- > Cross-Browser Compatibility
- > Declarative Data Binding
- > Accessibility Features
Responsive Design
With an increasing focus on diverse device usage, the responsive design is crucial. D3.js Development Services now integrate responsive features to ensuring that visualizations modify seamlessly to various screen sizes that providing an optimal viewing experience on desktops, tablets and mobile devices.
We Start Here
At the heart of our approach is a commitment to crafting dynamic and interactive data visualizations that breathe life into your information. We start by understanding your unique needs that ensuring a customized approach to every project. D3.js is renowned for its excellence in creating lovely visuals that serves as our primary tool to extend the capabilities of HTML, CSS and JavaScript seamlessly. Whether you are looking to enhance user interfaces, develop custom charting libraries or create immersive dashboards, our skilled team is assured to bring your vision to life.

Interactive Dashboards
Elevate your decision making processes with interactive dashboards powered by D3.js. We specialize in creating dynamic dashboards that allow users to explore and analyze data effortlessly to encourage a deeper understanding of trends, patterns and outliers.

Geospatial Data Visualizations
Harness the power of geospatial data with custom map visualizations. Whether you need to represent regional trends, demographic data or location specific insights then our D3.js developers can create compelling and informative geospatial visualizations.

Custom Styling And Theming
Infuse your brand identity into data visualizations through custom styling and theming. Our D3.js developers ensure that the visuals align seamlessly with your brand guidelines, creating a cohesive and professional look across all your data-driven content.

User Feedback Mechanisms
Encourage user engagement and gather valuable insights through interactive feedback mechanisms. Our D3.js development services include the implementation of features like surveys, comments and user ratings that providing a channel for users to express their thoughts and preferences.
D3.JS Development Framework

Performance Optimization
We optimize performance in our architecture through techniques like data streaming and efficient rendering. This ensures D3.js visualizations load quickly and respond smoothly were even in environments with resource restrictions.

Version Control
Our development process includes robust version control practices to ensuring that changes to D3.js visualizations are tracked systematically for promoting transparency and simplifying collaboration among development teams.

Continuous Monitoring And Maintenance
Beyond initial development, our services include continuous monitoring and maintenance to ensuring that D3.js visualizations remain robust, secure and aligned with evolving business requirements over time.

Documentation And Training
We provide comprehensive documentation for our D3.js solutions for empowering clients to understand and maintain their visualizations. Additionally, we offer training sessions to make easy knowledge transfer and empower clients to manage and update visualizations independently.
Frequently Asked Questions
Latest Blogs
Uncover fresh insights and expert strategies in our newest blog! Dive into the world of user engagement and learn how to create meaningful interactions that keep visitors coming back.Ready to transform clicks into connections?Explore our blog now!

- Games


- India

- United States

316 8th Avenue, New York, NY 10012, United States

[email protected]

- Canada
40 A, 100 Main St E, Hamilton, Ontario L8N 3W7
[email protected]

- UAE
406, Building 185 Street 10,Jebel Ali Village,Discovery Gardens
[email protected]

- United Kingdom
28 S. Green Lake Court Fleming Island, FL 32003
[email protected]